There’s more than one way to get where you’re going in QuickBooks. The software was designed to make similar information available by taking multiple paths. This gives you the option to choose what makes the most sense for you, and what’s most convenient.
Let’s say you need to get a quick summary of your finances. There are multiple choices. You could, for example:
- Run a Report. This gives you the opportunity to narrow down the data in your company file so QuickBooks only displays exactly what you want to see. It also takes time.
- Go to the Customer Center or Vendor Center. You can learn everything you need to know about your business associates and related transactions. But again, this method isn’t very speedy.
There are better ways to get fast access to information about your company’s health: Insights and Snapshots.
What Are Insights?
When you open the 2021 version of QuickBooks (this is also available in some earlier versions), you’ll see two tabs at the top. One says Home Page and the other, Insights. Click on Insights.
You can modify QuickBooks’ Insights page to display just the set of charts and graphs that you want.
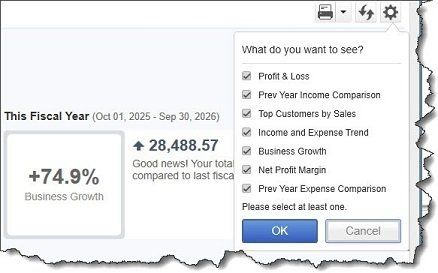
To ensure that you’re seeing everything that’s available, click the gear icon in the upper right. This opens a list of all of the charts and graphs that are available on the Insights page. If they’re not all checked, go ahead and click in front of the ones that aren’t turned on so you can see everything at first. You can change this later.
Directly below the gear icon, QuickBooks displays either Cash Basis or Accrual Basis. You would have established this when you were setting up QuickBooks. If you’re not absolutely sure what the difference is or whether you made the right choice, please contact us.
How Do You See All of the Charts?
QuickBooks can’t show all of the content available for the Insights screen at one time, so you won’t see everything if you’ve selected all seven options. You should see the Profit & Loss chart at the top. You can change the date range by clicking the down arrow next to the field in the upper left. Below that are two additional charts that remain on the screen even if you move on to additional content: Income and Expenses. These three graphs give you a quick look at whether you’re making or losing money. Two links here allow you to Create Invoice and Create Bill.
To get to the other charts, click the Next arrow to the right of Profit & Loss. Keep clicking to see six more graphical representations of various elements of your business. They are Prev(ious) Year Income Comparison, Top Customers by Sales, Income and Expense Trend, Business Growth, Net Profit Margin, and Prior Year Expense Comparison. Like you could with Profit & Loss, you can change the date ranges for these charts.
The first three that appear are self-explanatory. If you have questions about any of the others, please let us know. These charts can provide a good understanding of problems that may be lurking, and we encourage you to look at them every time you open QuickBooks.
What Are Snapshots?
You can see a great deal of information about individual customers by viewing their Customer Snapshot.
There’s some overlap between Insights and Snapshots in terms of content, but there are plenty of new charts here, too, in addition to tables and links to actions. To see them, click Snapshots in the QuickBooks toolbar. You’ll see that there are three kinds, accessible by clicking labeled tabs:
- Company. The
Company Snapshot
displays some of the charts you saw on the
Insights screen, but it also includes tables and graphs like
Account Balances, Customers Who Owe Money, and
Expense Breakdown.
- Payments. How do your accounts receivable (A/R) look? This screen tells you, in great detail. One chart compares your paid invoices to your unpaid ones and another shows you how much money is tied up in overdue payments (1-30, 31-60, 61-90, and greater than 90 days). There are tables listing
Recent Transactions,
Customers Who Owe Money, and
Payment Reminders. And links take you to related reports and payment activities.
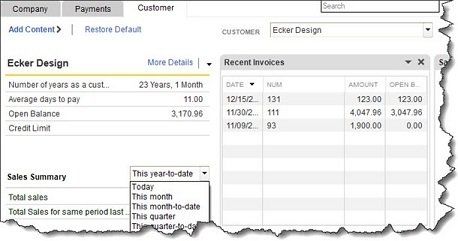
- Customer. This screen provides different information about each customer than you’ll find in the Customer Center. There are details like Number of years as a customer and Average days to pay. Tables list Recent Invoices and Recent Payments, and charts illustrate their Sales History and Best-Selling Items.
If you’d like to make one of these Snapshots appear as your opening page, display it, and then open the Edit menu and select Preferences. Click Desktop View in the left vertical pane. With My Preferences open, click on the button in front of Save current desktop to check it, and uncheck Show Home Page when opening a company file.
We know it’s tempting to just open QuickBooks and do your daily work, then get out. But we strongly recommend that you take a few minutes every time you run the software to use these tools that excel at showing you how you company is doing. Questions? We’re here to answer them.